Every two to seven years the weather in South-East Asia, Australasia and the Americas is disrupted. Weather in regions around the Pacific Ocean become more extreme and erratic.
This is caused by the El Niño, a large scale ocean-atmosphere interaction, in which warm western Pacific water is transported to the cooler central and eastern equatorial Pacific. Here it triggers new areas of towering atmospheric convection which change the climate of the Pacific.
El Niños can have an enormous impact on local economies from Peru to the Philippines. It can also result in extreme weather events and natural disaster. According to US National Oceanic and Atmospheric Administration, the 1997-1998 El Niño resulted in 24,000 lives lost and $34 billion in economic damages around the world. In recent research, which used high resolution climate model data stored on JASMIN, Dr David Webb of the UK National Oceanography Centre gained new insights into the ocean processes driving the strongest El Niños.
|   Image 1
|
Researching El Niño
The effects of El Niño have been recorded for centuries, but new technologies over the last few decades have accelerated our ability to model and understand the processes involved.
Scientists use instruments on board research ships and moorings to study atmospheric conditions and ocean currents to better understand El Niño. These instruments provide scientists with a lot of information but only about specific locations or a tiny swath of the ocean. With only this limited amount of data, breakthroughs stalled.
Advances in Earth observation using satellites means that the entire ocean can now be monitored frequently. At the equator, with two spacecraft working in tandem, the Sentinel-3 satellites return to the same spot above the Earth every day and send back information about sea surface temperature and colour.
This produces an enormous amount of data, now going back decades, which needs to be stored and processed. This is where JASMIN comes in.
RAL Space's Centre for Environmental Data Analysis, alongside STFC colleagues at the Scientific Computing Department, run JASMIN, a super-data computer which has been purpose-built to store and process huge volumes of data for the environmental science community. By using JASMIN, scientists can access large amounts of satellite data alongside other environmental data and process it quickly and efficiently.
Understanding El Niño through big data
When colleagues, working with the Met Office, developed a new high-resolution global version of the NEMO ocean model, Dr Webb took on the task of validating the model results in the equatorial Pacific, accessing the model data via JASMIN.
The model used 36 TB of storage on JASMIN, bigger than could be easily dealt with on most computing systems at research institutes, though just a small portion of the total NEMO Group WorkSpace. Using JASMIN, Dr Webb and the team could sort through the data online in a coordinated way making use of the huge processing capacity remotely and download more manageable chunks to be analysed locally.
|  Image 2 |
Higher resolution data enables new insights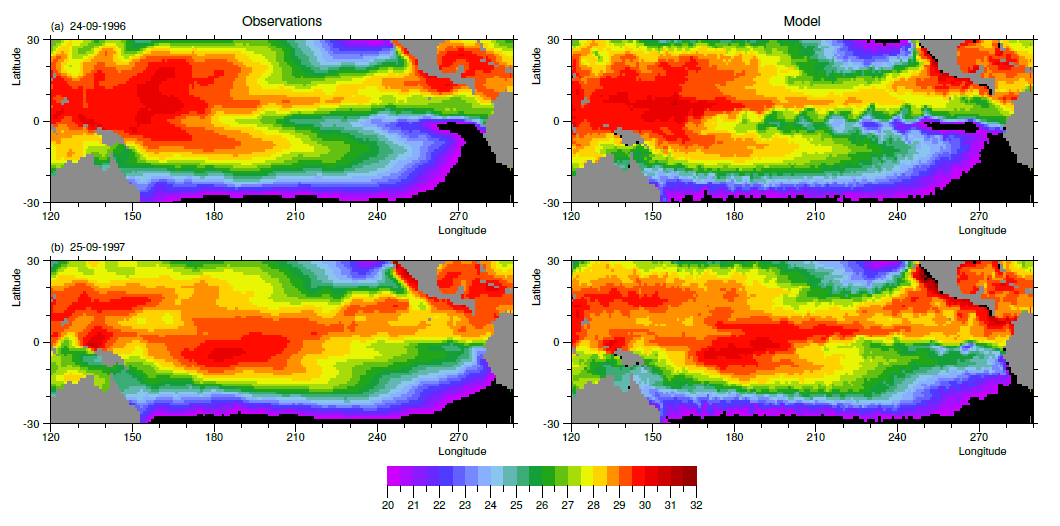
|
Image 3
Earlier studies have focused on wave processes and westerly wind bursts driving warm water along the Equator. Dr Webb was able to look in more detail at Pacific Ocean currents at higher latitudes and found that the North Equatorial Counter Current (NECC), plays a much more important role driving El Niño than is normally attributed to it.
“The NECC flows from west to east against the direction of the main equatorial current, explained Dr Webb. “Eddies between the two currents usually mix the cold water of the equatorial current with the warm water of the NECC, with the result that the warm water travelling eastwards from the western Pacific is cooled before reaches the eastern Pacific and the shores of South America."
During the extreme El Niño's of 1982-1983 and 1997-1998, Dr Webb found that the winds drop, causing the eddies mixing the waters to die away so that warmer waters reach the eastern Pacific.
Without the cooling eddies, the NECC waters reaching the eastern Pacific can reach the crucial temperature of 28.5 ֯C or above. This is the optimum temperature at which the big convection storm clouds begin to form, resulting in the huge amounts of rainfall in Central and South America characteristic of El Niño and disrupting atmospheric feedback loops across the region.
Dr Webb added, “The model results also emphasised the importance of the seasonal change in the strength of the NECC. Winds in the eastern Pacific are responsible for a Rossby wave, which can be thought of as an elongated version of an atmospheric low pressure system. This travels across the Pacific each year and means that the NECC is strongest in the central Pacific each autumn."
Dr Webb found that in the years with the strongest El Niños, the arrival of the El Niño in the central Pacific coincided with the Rossby wave. This results in more warm water than normal reaching the eastern Pacific. In these years the warm nutrient poor water arrives off South America just before Christmas, the timing being responsible for the name “El Niño" or “The Christ Child".
While the potential importance of the NECC was first proposed in the 1970s by oceanographer Klaus Wyrtki, this was the first time that his hypothesis has been supported by model results and real-world observations – and this is only thanks to the extensive satellite coverage, high-resolution models and computing power now available.
David Webb said "Although there were many groups involved in developing and running the ocean model and in collecting the data used in this study, without the JASMIN storage and data processing facilities, this research on the origins of the El Niño could not have gone ahead."
Research saving lives and livelihoods
Understanding the mechanisms driving El Niño will help oceanographers and meteorologists predict when the El Niño will occur and how severe it's effects might be around the Pacific. This could help communities prepare and protect themselves from the worst impacts of extreme weather.
The NEMO model and all the data used by Dr Webb are freely available to environmental researchers on JASMIN through the CEDA Archive.
Dr David Webb's research can be found here: https://noc.ac.uk/n/David+Webb
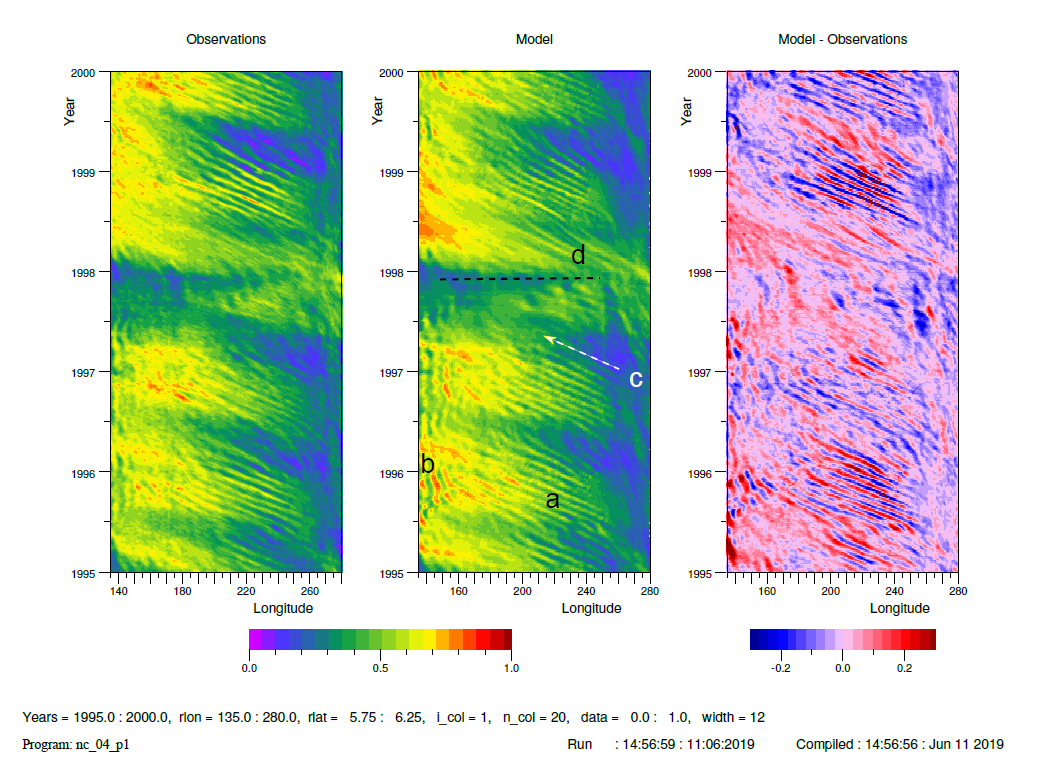
Image 4
Image credits:
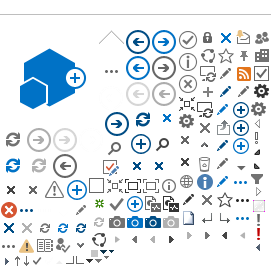
Image 1: Surface temperature (degrees C) in (a) late September 1981, a normal year, and (b) late September 1982, during the growth of the strong 1982-1983 El Niño. Credit: David Webb.
Image 2: The JASMIN super-data computer. Credit: STFC RAL Space.
Image 3: Observed and model sea surface temperatures in (a) late September 1996, a normal year, and (b) late September 1997, during the growth of the strong 1997-1998 El Niño. Units are degrees Celsius. For these figures the model datasets have been averaged onto the same 1◦ grid as used for the satellite-based data set. Credit: Webb et al, 2020.
Image 4: Observed and model sea surface height and their difference in the Pacific at a latitude of 6◦ N between 135 and 280◦ E (80◦ W), showing (a) westward- propagating tropical instability waves or eddies, (b) quasi-steady meanders near the start of the NECC, (c) westward-propagating annual Rossby wave and (d) sudden change marking the end of the growth phase. Units are metres. Credit: Webb et al, 2020.